Investigation. The rosters. The degree counts. The censuses. The notices. The arithmetic nobody puts on one page.
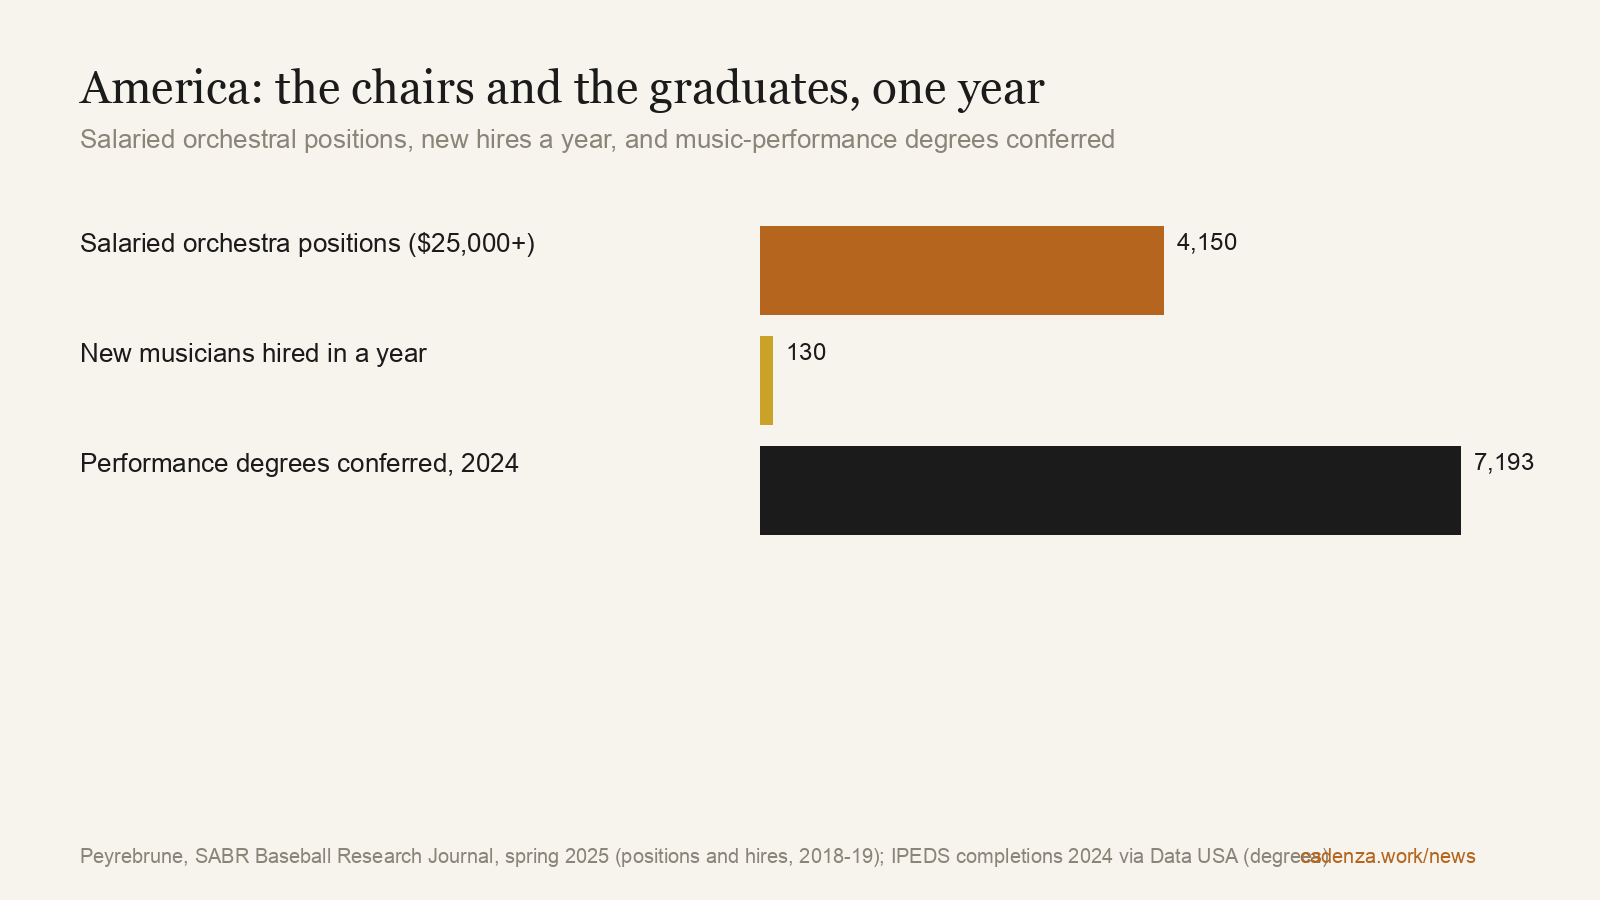
There are, by the most detailed published count we found, about 4,150 salaried orchestral positions in the United States that pay $25,000 a year or more. In an average year about 130 musicians are hired into them for the first time. In 2024, American colleges and conservatories conferred 7,193 degrees and certificates under the general music-performance code, and 9,286 across all the performance codes once the instrument-specific ones the conservatories use are added. Those three numbers come from three different documents, kept by three different institutions, none of which has ever printed them on the same page. This is the page.
This is not an argument against studying music; the same data that measures the odds also measures the alumni who are working, and we print those figures too. Nor is it an accusation. Every institution named here has simply published its numbers. The problem is what the numbers say side by side. It ends with a plan.
Part I — The chairs
Start with what exists. Every count of the orchestral labour market begins with the two player conferences of the American Federation of Musicians, because they are the only bodies that know, roster by roster, who holds a salaried chair.
The International Conference of Symphony and Opera Musicians, founded in 1962, describes itself as representing "over 4,000 musicians from 51 major symphony orchestras throughout the United States." These are the full-time and near-full-time orchestras: the 52-week contracts and the 40-week ones, the ensembles whose names appear on the recordings. The Regional Orchestra Players Association, formed in 1984, represents "nearly 90 orchestras and more than 6000 musicians in North America," and its members are the regional orchestras, where a chair is often a per-service contract rather than a salary.
Ten thousand names across two lists, then. But a name on a ROPA roster is not a salary, and the number that matters for anyone deciding whether to try for this career is the number of chairs that pay a living. That count was made by Henry Peyrebrune, a bassist in the Cleveland Orchestra, who compared complete ICSOM rosters between the 2006–07 and 2018–19 seasons and published the result, of all places, in the Baseball Research Journal of the Society for American Baseball Research in April 2025, under the title "It's Supposed to Be Hard: Why It's Harder to Get an Orchestra Job than to Play Professional Baseball." His figure: approximately 4,150 salaried orchestral positions paying $25,000 or more a year in the 2018–19 season, spread across roughly 55 orchestras, "ranging from full-time, 52-week salaries down to core positions for partial-year seasons."
Peyrebrune's other numbers set the scale. The seven largest American orchestras, the "Big 7", employed 727 musicians, against 780 players on Major League Baseball's active rosters. Over his twelve-season window, an average of about 130 new musicians a year joined the salaried pool. The average orchestral career, once won, ran to 31.9 years, against 3.7 years for a ballplayer. Openings, he concluded, are "nine times more scarce for orchestra musicians" than for baseball players, and the chance that a musician who sets out for a salaried chair holds one within ten years is "nearly 5%." A separate estimate, published in May 2026 by Alfredo Muñoz on the newsletter Before The Audition, takes a different route to the same place: assume 3 per cent annual turnover on a pool of roughly 4,000, and you get "roughly 120 openings annually." Muñoz adds the caveat that matters most to a graduate: many advertised vacancies "are filled by musicians already employed in other orchestras moving laterally between institutions," so the number of advertised auditions overstates the number of doors that open for someone who does not yet have a chair.
So the American market, at the salaried level, is a pool of about 4,150 chairs that turns over at 120 to 130 a year, and everything else in this investigation is measured against those two figures.
What is open right now
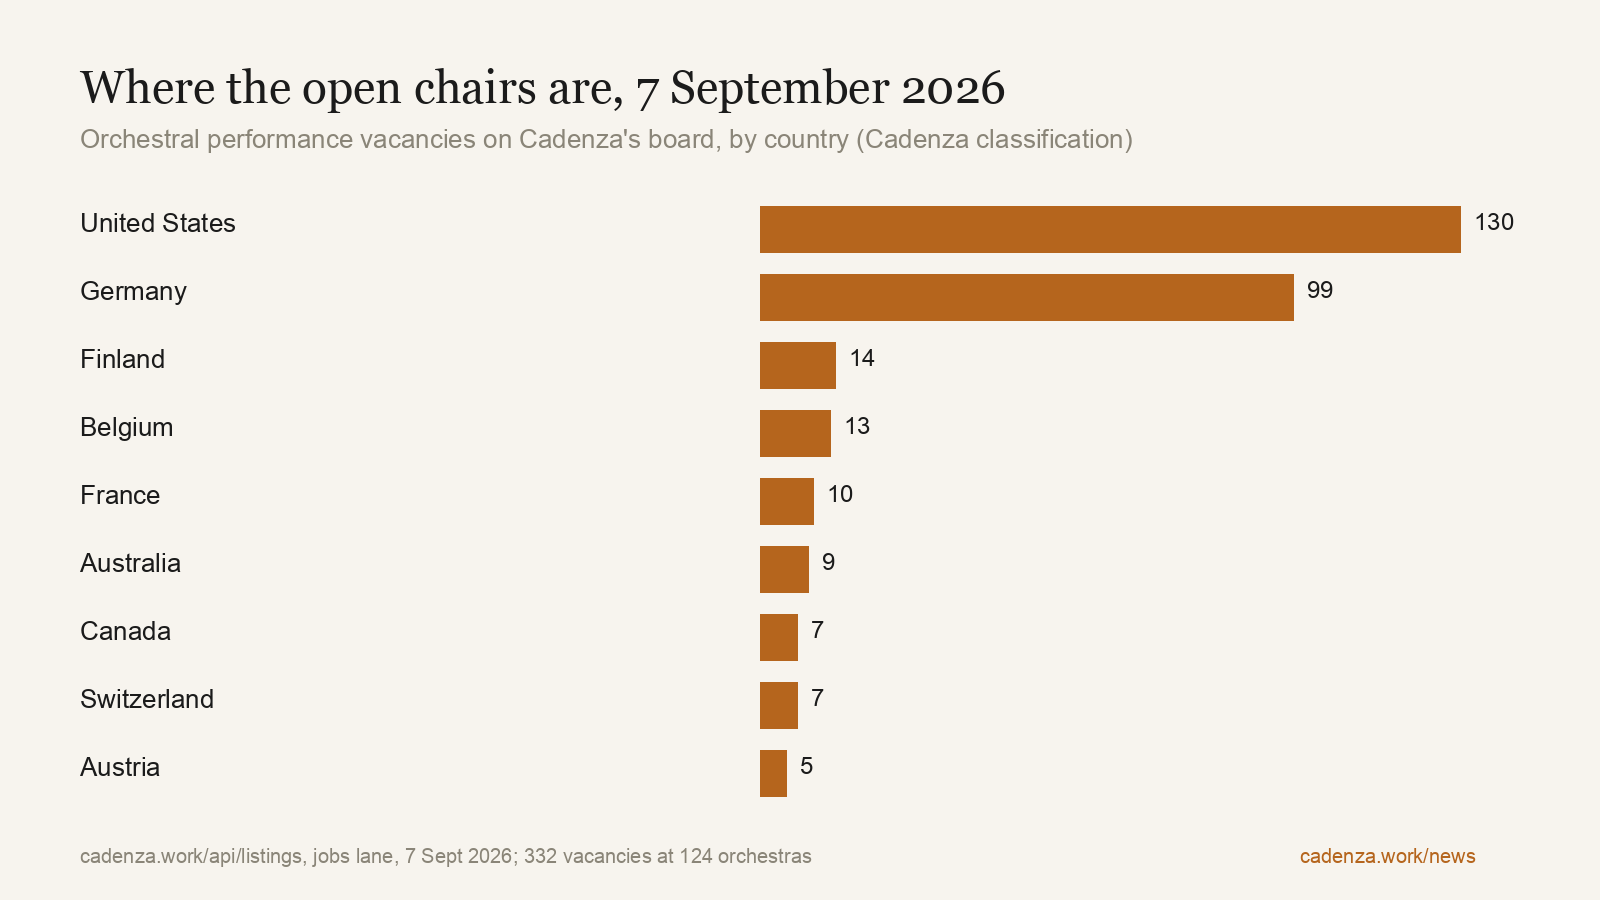
Cadenza's own board gives a live reading. On 7 September 2026 the jobs lane held 492 listings. Setting aside teaching, administrative and staff posts leaves, by our own classification, 332 orchestral performance vacancies at 124 orchestras in 19 countries: 130 in the United States, 99 in Germany, 14 in Finland, 13 in Belgium, 10 in France, 9 in Australia, 7 each in Canada and Switzerland, 5 in Austria. Twenty-nine of them close before 7 October; we checked every one against the orchestra's own posting for the audition ledger published alongside this piece. Those 332 are not all salaried, not all permanent and not all new (some are the lateral moves Muñoz warns about), but they are the visible surface of the market on one day, and 332 is a number to set beside 7,193.
Part II — The graduates
The federal government counts degrees by field with a six-digit code. Music performance is 50.0903. The Integrated Postsecondary Education Data System, IPEDS, collects the count from every institution that participates in federal student aid, and the series, read through Data USA's API on 7 September 2026, runs like this:
| Year | Music performance completions |
|---|---|
| 2012 | 8,284 |
| 2013 | 8,561 |
| 2014 | 8,329 |
| 2015 | 8,133 |
| 2016 | 8,246 |
| 2017 | 7,727 |
| 2018 | 7,812 |
| 2019 | 7,857 |
| 2020 | 7,957 |
| 2021 | 7,335 |
| 2022 | 7,281 |
| 2023 | 7,240 |
| 2024 | 7,193 |
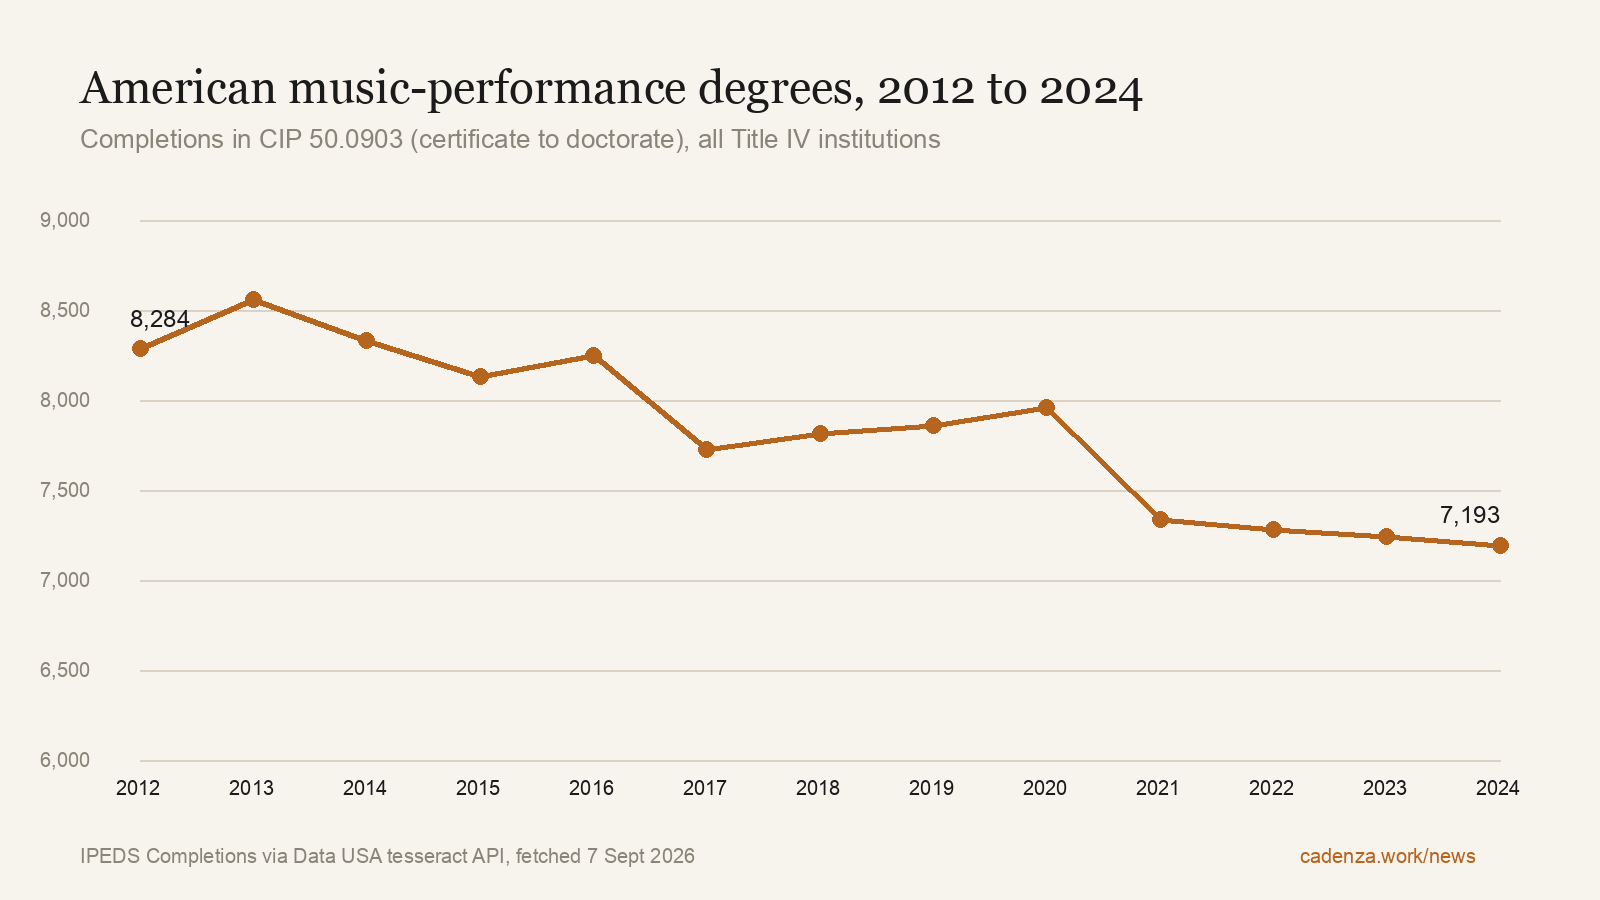
Two things are visible at once. The number is falling, by 13 per cent over twelve years and with a step down after 2020 that has not recovered. And the number is still enormous relative to the market it feeds. Seven thousand one hundred and ninety-three completions in a year, against 130 first-time salaried hires, is a ratio of 55 to 1. It is not a ratio of applicants to jobs, because not every performance graduate wants an orchestra chair, and because the 130 hires include people who graduated years earlier; it is a ratio of the pipeline's output to the market's absorption, and it has been above 50 to 1 for every year in the series.
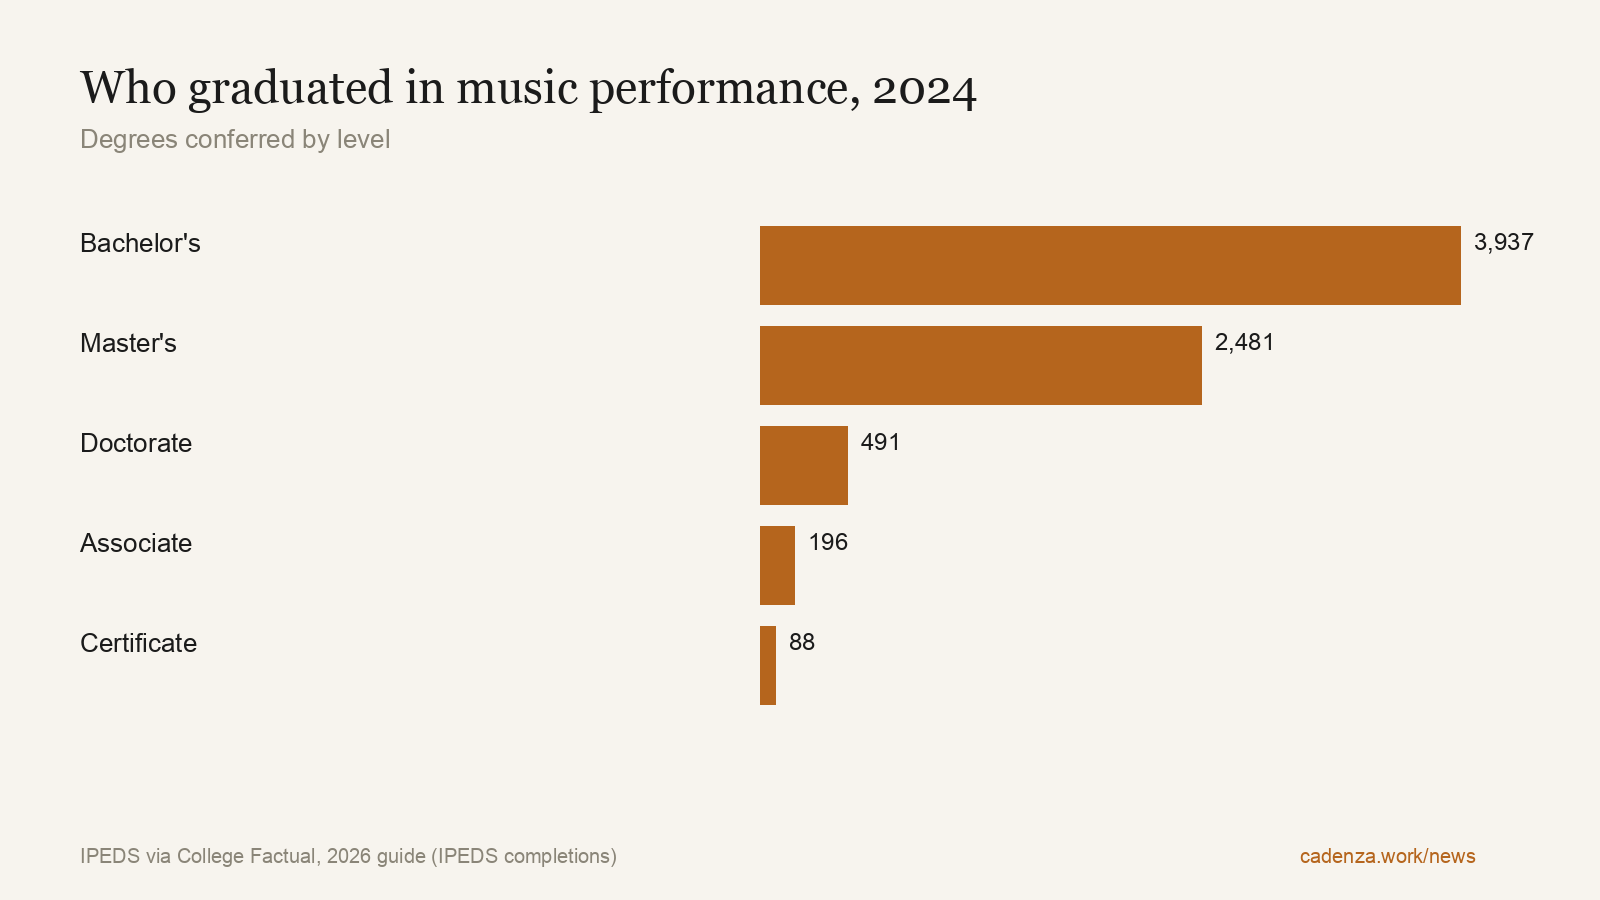
College Factual's tabulation of the same IPEDS data breaks the 7,193 down by level: 3,937 bachelor's degrees, 2,481 master's, 491 doctorates, 196 associate degrees and 88 certificates, from 370 institutions. The master's figure is the telling one. Nearly 2,500 people a year complete a second performance degree, which in this field is often the credential taken to prepare for auditions, and the master's cohort alone is nineteen times the annual intake of the salaried pool.
The 7,193 is itself an undercount, and the reason is worth a paragraph. The federal classification gives music performance a general code, 50.0903, and separate codes for stringed, keyboard, brass, woodwind and percussion instruments and for voice and opera. The large universities report under the general code: Indiana University Bloomington conferred 339 general-performance degrees in 2024, Berklee 325, the University of Rochester (Eastman) 206, Johns Hopkins (Peabody) 200. The conservatories mostly do not. Juilliard reported 117 degrees in stringed instruments, 47 in keyboard and 24 in voice and opera in 2024, and only a handful under the general code; Curtis, the New England Conservatory and the Manhattan School of Music report the same way. Summing the seven performance codes gives 9,286 completions in 2024 (7,193 general, 668 voice and opera, 589 strings, 534 keyboard, 158 woodwind, 109 brass, 35 percussion), down from 10,002 in 2012. Against 130 first-time salaried hires that is 71 to 1. The article keeps the conservative 7,193 in its headline figures; the wider count only makes the sum worse.
Performance is a subset. Cadenza's earlier investigation, The $300,000 Music Degree, put music degrees from US public four-year institutions at 13,950 a year on Data USA's 2023 figure and priced the four-year cost of the best-known conservatories at up to $363,000. The same piece set music degrees against roughly 130 salaried openings and arrived at 107 to 1; performance degrees alone give 55 to 1. Either way the order of magnitude is the point, and it does not move.
What the graduates earn is also on the record, because the Department of Education's College Scorecard tracks earnings by field of study. College Factual's summary of that tracker gives median earnings for music performance graduates of $29,248 one year after completion, $35,586 after four years and $40,828 after five. Those are medians across everyone with the degree, in every job, and they sit below every full-time orchestral minimum in the ledger we print in Part V.
The German pipeline
Germany counts differently and the count is instructive. The Deutsches Musikinformationszentrum, working from the Federal Statistical Office, records 31,092 subject registrations in music-profession degree programmes in the winter semester of 2024/25. The largest field is instrumental and orchestral music, with 8,909 students; singing has 1,563 and conducting 324. And a companion table records that 6,047 of the instrumental and orchestral students, about 68 per cent, hold foreign citizenship, up from about 52 per cent twenty years earlier.
Two-thirds of the people training to play in a German orchestra are not German. That will matter when we reach the empty chairs.
Part III — The odds
An orchestral audition is a job interview with a hundred or more candidates, and the number is not a legend. Peyrebrune's paper records "as many as 200 résumés for one position." Douglas Yeo, for many years the bass trombonist of the Boston Symphony, wrote in his guide to the audition system that "more than 200 players may wish to come to audition for a single position," and described the screening systems orchestras use to reduce the field "to a reasonable number that can be heard in one or two days." The Berlin Philharmonic's own account of its process is a reminder that the odds can be worse than the arithmetic: applications are made on an online form with audio samples, "all who score points here are invited to attend a formal audition," there are "several rounds," first before the section and then before the whole orchestra, and at the end of the process the orchestra as a whole decides whether a candidate meets its expectations, and "If no one does, the position remains vacant and the search continues."
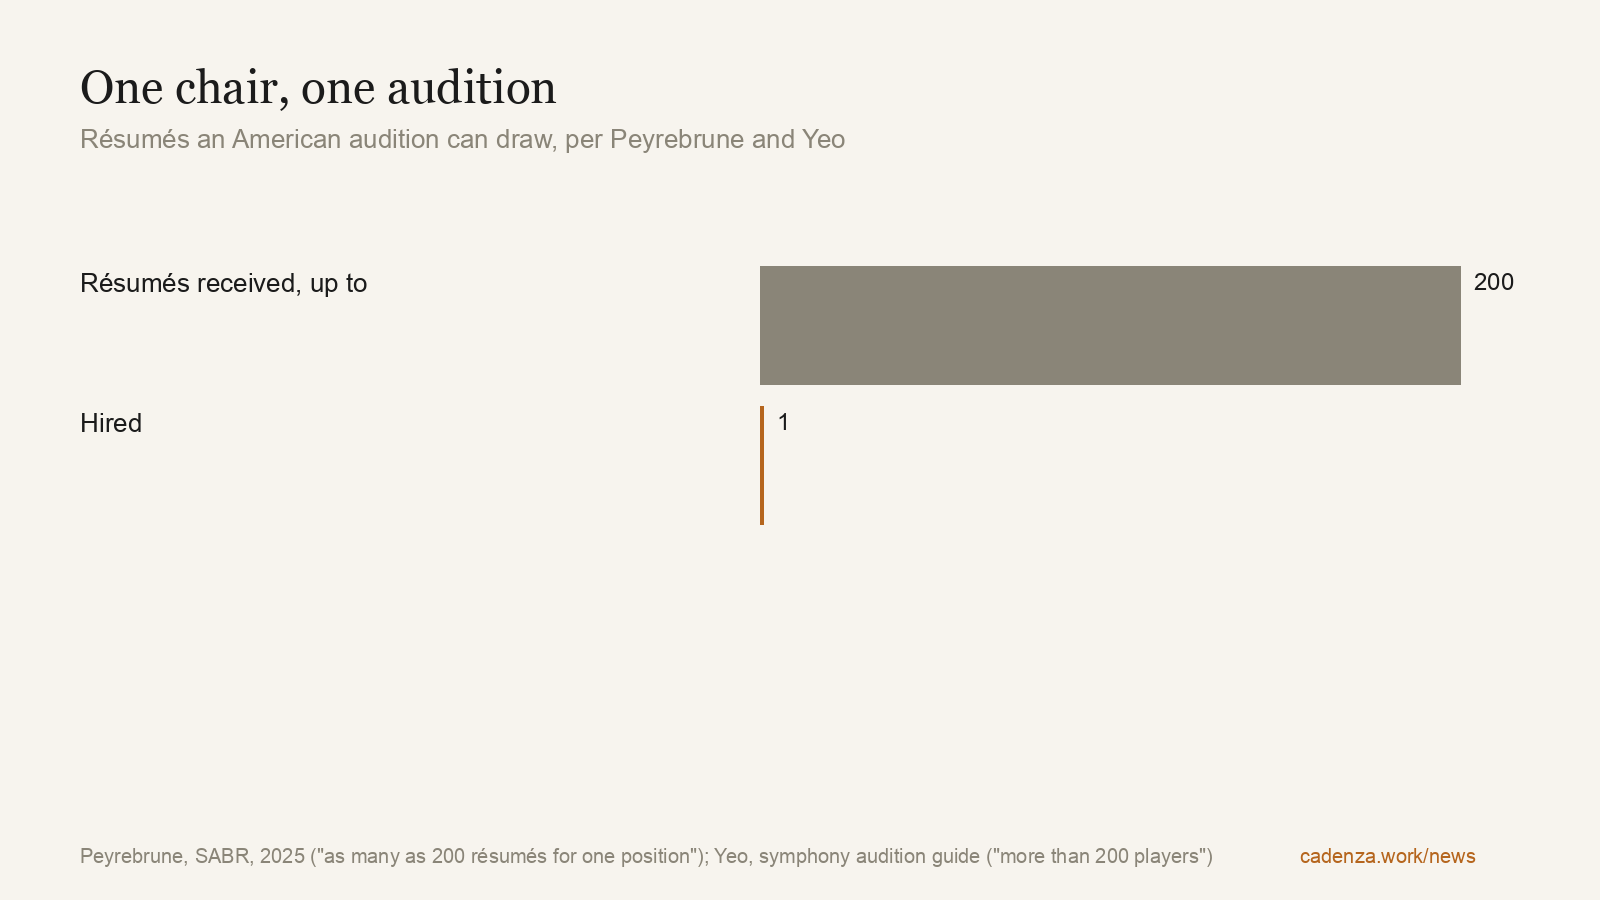
Put the pieces together and the arithmetic of a single career looks like this. A performance graduate enters a market of about 4,150 salaried chairs that opens 120 to 130 of them a year. Each opening draws up to 200 applications, a share of them from players who already hold a chair elsewhere. Peyrebrune's estimate that a candidate has "nearly 5%" odds of holding a salaried chair within ten years is, by his own account, a lower bound: it assumes every graduate keeps trying for a decade, and he notes that as graduates leave the field the denominator shrinks and the success rate rises, and it counts a win at any level, from a 52-week contract down to a $25,000 core position.
The comparison he chose is the one that explains it. Before 2020, about 1,200 players a year signed with Major League Baseball organisations and went on to play Single A or higher, and roughly 24 per cent of the eligible amateur pool advanced past the rookie level. Orchestras hire 130. The ballplayer who makes it plays for 3.7 years on average; the musician who makes it plays for 31.9, which is precisely why the chairs do not come open. An orchestra is a workforce with almost no attrition, fed by a school system with almost no brakes.
Part IV — The price of the ticket
Before a musician can lose an audition they have to pay to attend it, and the rule of the American system is that the candidate pays. Nathan Kahn, a negotiator in the AFM's Symphonic Services Division, put it plainly in the union's own magazine in 2015: "I have yet to hear of any symphonic orchestra who pays the expenses of preliminary round candidates." Many orchestras, he added, do pay the travel of finalists called back for the last round. Orchestras, he wrote, "may even require audition candidates to send a deposit check," which "will be returned or destroyed" if the candidate turns up.
The deposits are still there. Of the 29 vacancies closing before 7 October in Cadenza's ledger, nine notices from six American orchestras ask for a refundable deposit with the application: $35 at Stockton, $50 at Hartford and Elgin, $100 at Jacksonville and Virginia, an unstated sum at San Diego. Sarasota's notices for its September 2026 auditions ask for $75. The Quad City Symphony states, in its notice, that there is no deposit. No European notice in the ledger asks for one.
The deposit is the smallest line. The flutist Alyse Hokamp kept the receipts for her 2019 audition season and published them: six live auditions, $2,897 in total, "average cost= $483 per audition." Her itemised list shows where the money goes. Tucson cost $813: $450 in lessons, $16 in recordings to learn the excerpts, a $147 flight, a $129 hotel, a $65 rental car and $6 in fuel. Santa Cruz cost $660, of which $379 was the hotel. Austin cost $640 with a $246 flight and no hotel, because she stayed with friends. Dallas cost $292 because she stayed with family. The cheapest, Redlands, was $220. In five of the six the lesson was the largest single item; at Santa Cruz it was the hotel.
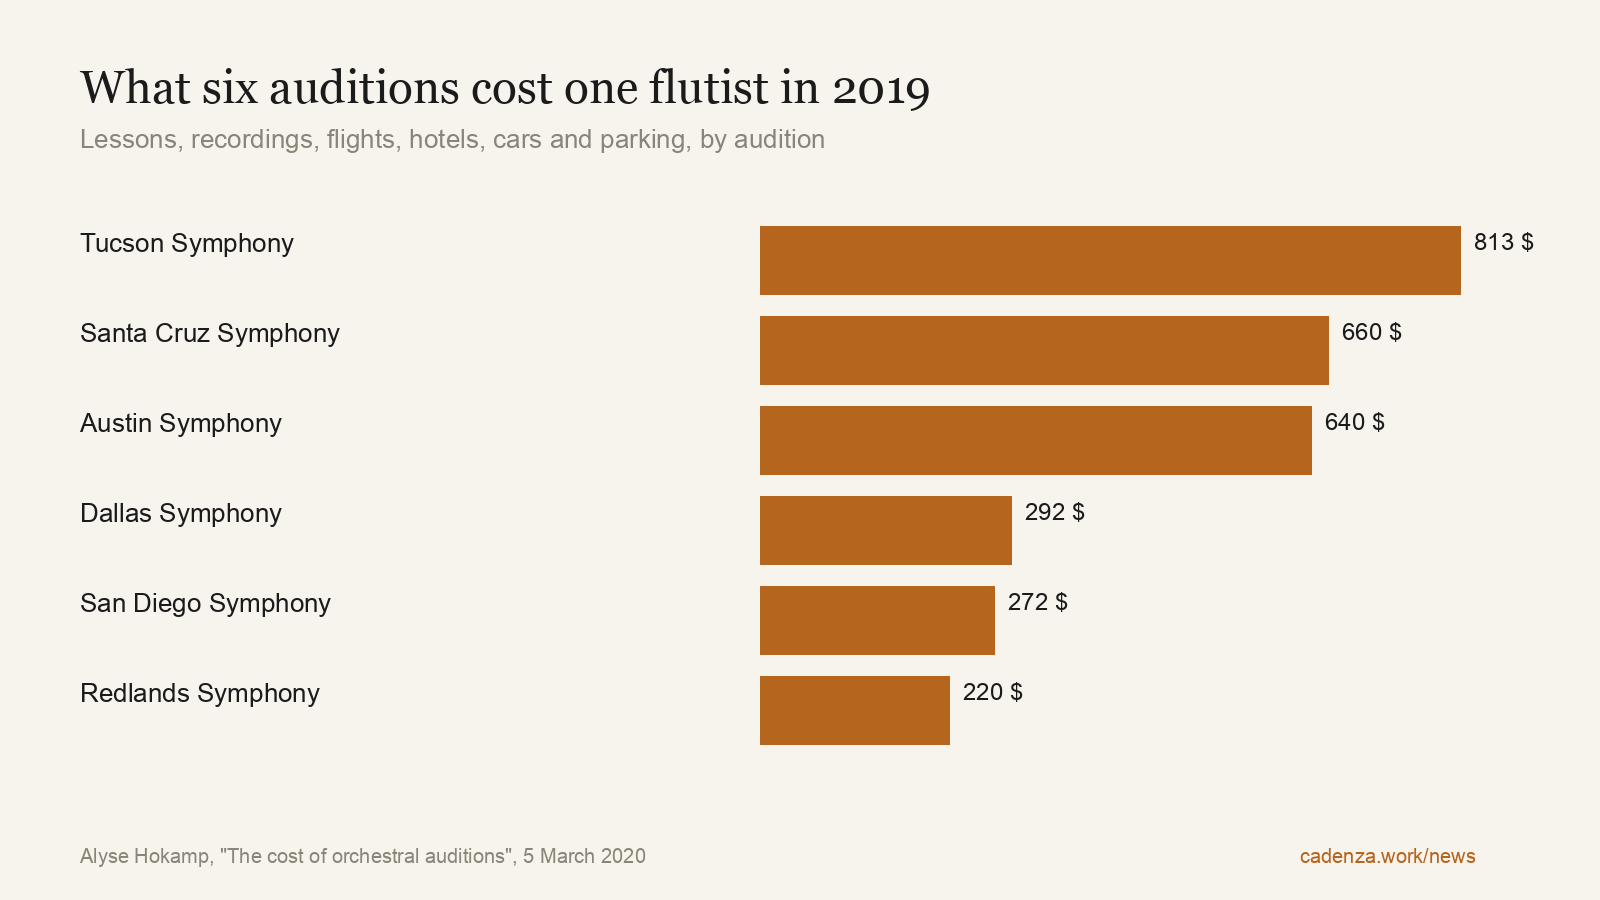
Six auditions at $483 is one season. A candidate who takes the ten-year path Peyrebrune measures, at the same rate, spends something on the order of $25,000 to $30,000 in travel, lessons and deposits on top of the degree, for odds Peyrebrune puts at roughly 5 per cent and calls a lower bound. The degree itself, for the conservatories whose costs we tallied in The $300,000 Music Degree, runs to $363,000 over four years at the most expensive, before a master's. Curtis, Colburn and Yale charge no tuition, as our guide to the tuition-free conservatories records, and admit around 4 to 6 per cent of applicants, which is to say that the free ticket is itself a lottery with the same odds as the audition.
The system does not charge for the audition itself, and orchestras have spent fifty years building a blind, screened process that is, in our view, fairer than most hiring in the arts. The cost is entirely in getting to the room.
Part V — What the chair pays
Now the other side of the ledger, which is the side the notices are least willing to print.
The best-paid chairs in America are a matter of public record because the contracts are announced. The San Francisco Symphony's 2025 agreement, reported by the San Francisco Chronicle and San Francisco Classical Voice, is retroactive to November 2024 and runs to November 2027; it moves the weekly base from $3,450 to $3,960 in its final six months, an annualised minimum of $205,920, which SFCV reports keeps the orchestra in the top five in the country. The blog All Is Yar, which tracks these contracts, compared the weekly bases as of November 2025: Boston $3,895, Chicago $3,810, New York $3,667, Philadelphia $3,390, and Los Angeles at $4,016 in total compensation including a housing allowance. Cadenza's own April survey, The Orchestra Pay Gap, put the section minimums of thirteen major orchestras between about $116,000 and $206,000 from their Form 990s and contract announcements.
Those are the 727 chairs of the Big 7 and their near neighbours. The other 3,400 salaried chairs, and the thousands of per-service ones below the $25,000 line, pay what the notices in the audition ledger say they pay, and this is where the record gets thin. Of the 29 notices closing this month, fifteen state a figure, one says the salary is individual, and thirteen say nothing at all. Where a figure is stated, it runs like this:
| Chair | What the notice says |
|---|---|
| Houston Symphony, Second Oboe | "52-week season which includes 9 weeks of paid vacation with a minimum annual salary of $113,360 for the 2025-26 contract year" |
| San Diego Symphony, Section Violin | "$112,965 minimum annual scale plus $3,000 electronic media guarantee"; 42-week contract |
| Jacksonville Symphony, Section Violin | "2026/27 Weekly Salary: $1,413.07"; "40-week season" ($56,522.80) |
| The Florida Orchestra, Section Viola | "$52,514.43 annual base salary ($1,419.31 base weekly rate x 37 weeks)" |
| Helsinki Philharmonic, II Concertmaster | "4164,71 - 4789,42 € / month" (€49,977 to €57,473 a year) |
| Regina Symphony, Assistant Principal Second Violin | "$45,752.01 minimum for 2026-27"; 37 weeks (Canadian dollars) |
| Virginia Symphony, Second Bassoon | $36,703.80 base, as carried by musicalchairs |
| Hartford Symphony, Violin I | "Guaranteed Services: 98"; "Annual Salary: $16,245.46" |
| Nürnberger Symphoniker, academy places | "€ 1150,- brutto/Monat" plus pension |
| Elgin Symphony, Principal Flute | "$217.01 per service" |
| Hartford Symphony, Section Cello | "Per Service Rate: $165.77" |
| Quad City Symphony, violins | "$147.00 per service" (principal), "$105.00" (section) |
| Stockton Symphony, horns, cello, bass | "Per Service: $140 (section)" |
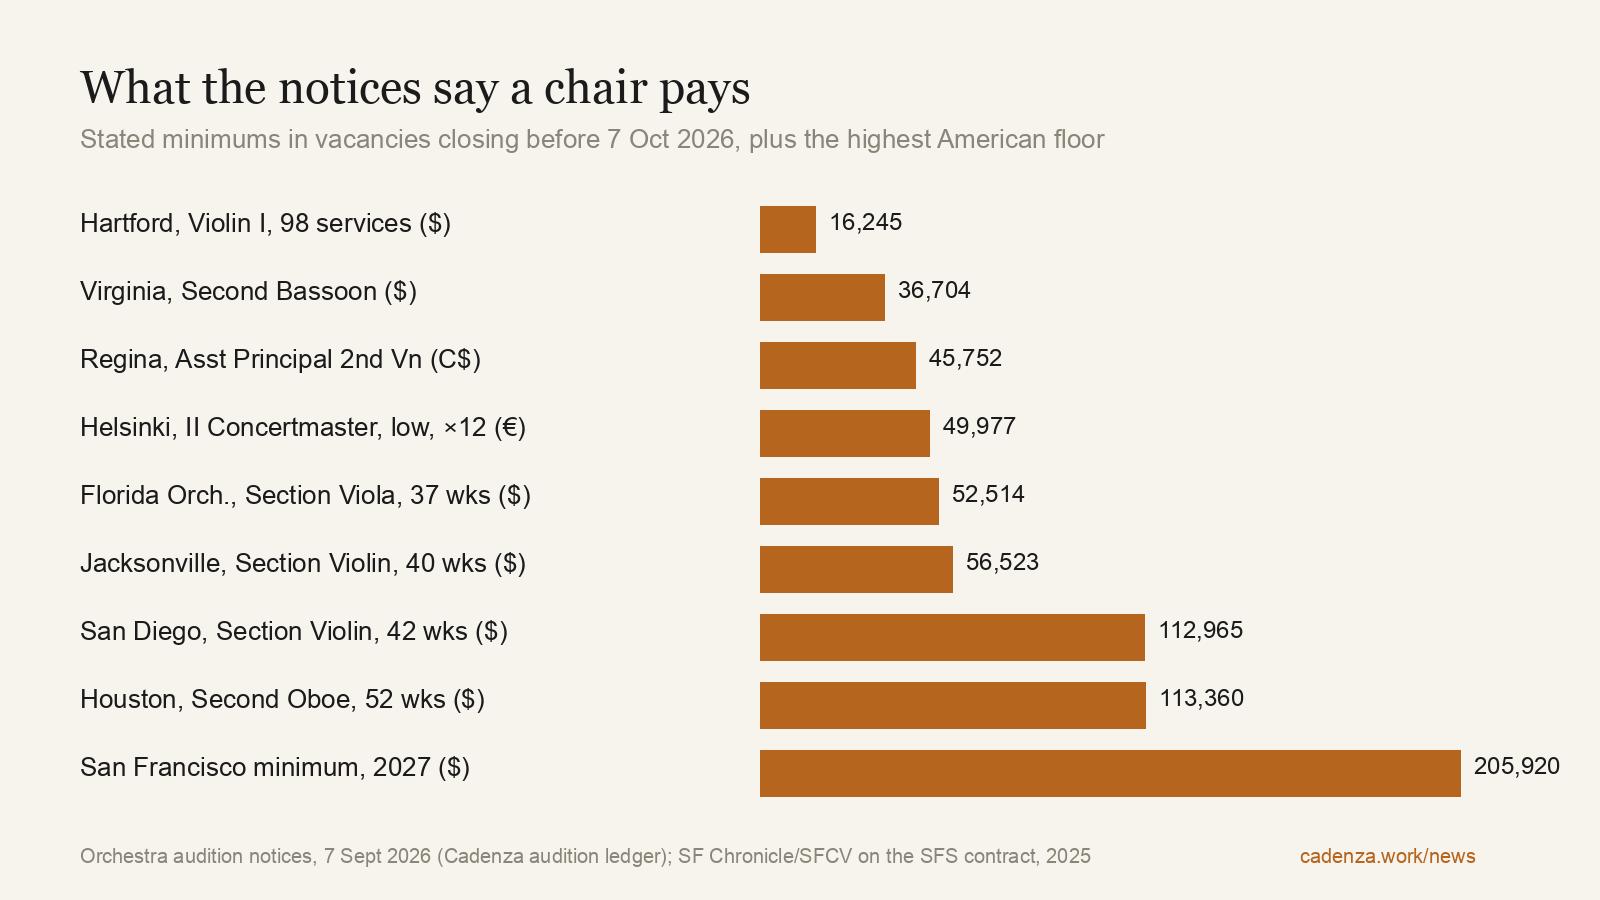
Read the table from the bottom. A section player in Stockton earns $140 a service. A chair in Hartford's first violins guarantees 98 services and $16,245.46 a year. A tenure-track second bassoon at the Virginia Symphony is offered $36,703.80. The full-season floor among this month's notices, at Houston and San Diego, is around $113,000, and the top of the market in San Francisco is $205,920. The spread inside one month's deadlines, Hartford to Houston, is 7 to 1; against San Francisco's floor it is nearly 13 to 1. The College Scorecard median for a performance graduate five years out, $40,828, sits between the Regina and Virginia rows.
And 13 of the 29 notices print nothing. Arizona Opera's three chairs, Opera Ballet Vlaanderen's three, the Concertgebouw's solo percussion, the Berlin Philharmonic's two cellos, San Diego's substitute timpani, and the four German chairs in Bielefeld and Nürnberg give no figure. In Germany the omission has an explanation: pay in the publicly funded orchestras is set by collective agreement, the TVK for concert and theatre orchestras, in published tables by orchestra group, and a German player is expected to know which group an orchestra is in. In America there is no published table a candidate is expected to consult; for ICSOM orchestras the union's wage charts exist, but Hartford's and Stockton's do not appear in them. Such a notice is, in our reading, simply a job advertisement that does not say what the job pays, addressed to people who will spend $483 to find out.
Part VI — The German paradox
Germany keeps a biennial census of every publicly financed orchestra, and in January 2026 it counted something it had never counted before.
The association unisono, formerly the Deutsche Orchestervereinigung, surveys the country's publicly financed orchestras every two years. The Deutsches Musikinformationszentrum publishes the series. In 1992, the first all-German count, there were 168 publicly financed orchestras with 12,159 budgeted positions. By 2018 mergers and closures had reduced the orchestras to 129 and the positions to 9,746. Since then the number has been stable: 129 orchestras and 9,748 positions in January 2026. The contraction fell overwhelmingly on the former East, where positions fell by 40 per cent between 1992 and 2020, from 5,032 to 3,132, against a 7 per cent decline, about 500 positions, in the West.
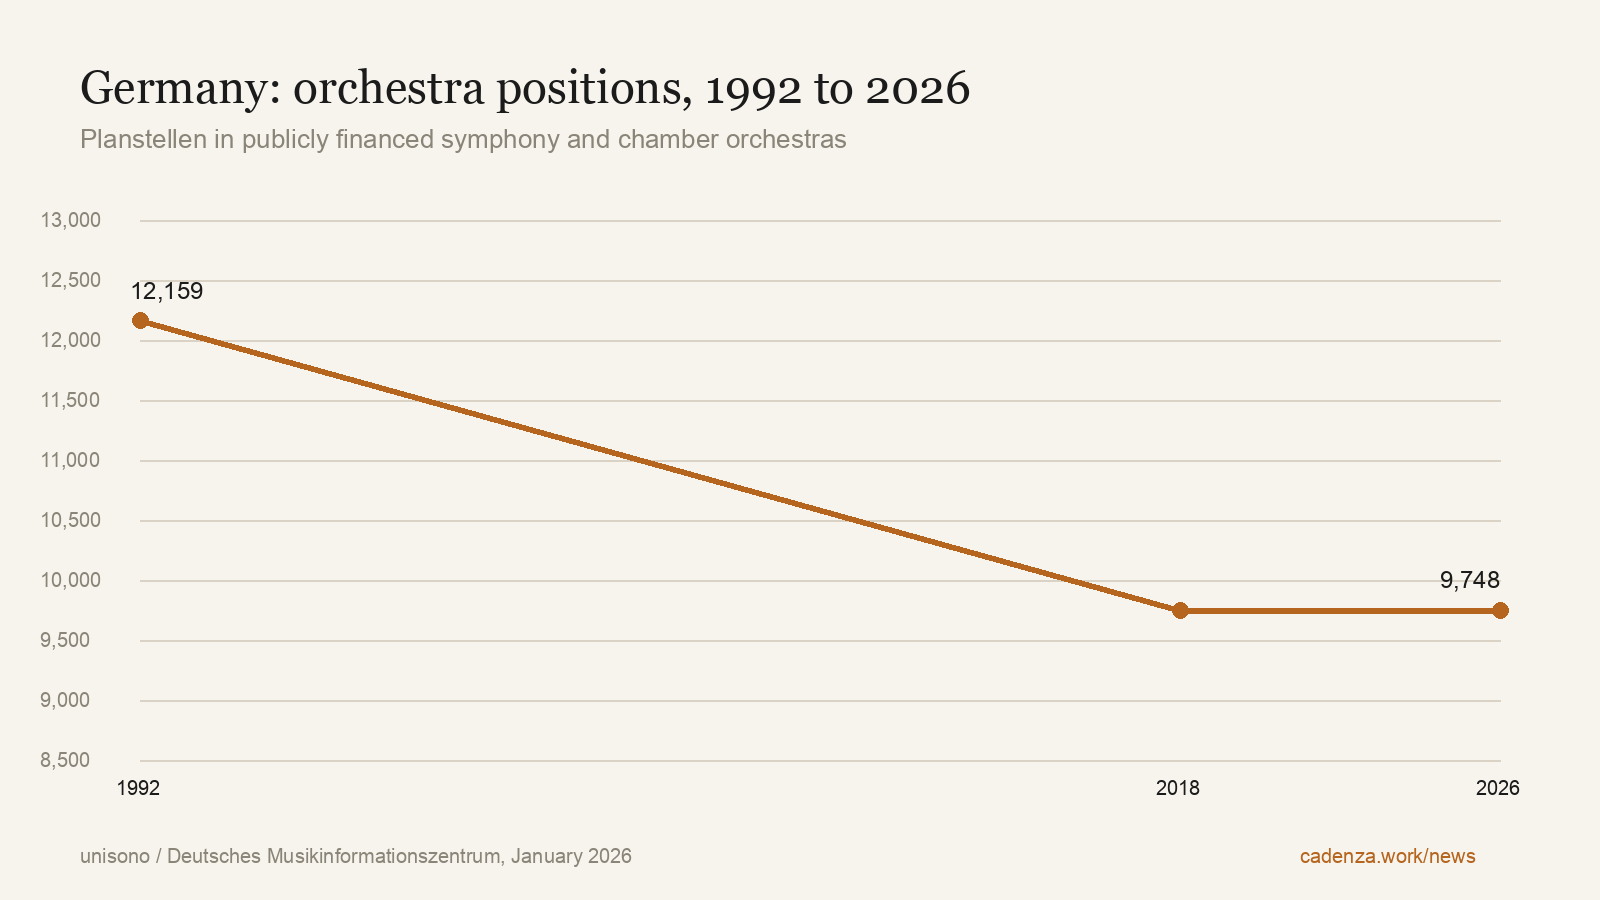
The new number is the one that matters. For the first time, unisono asked not how many positions were budgeted but how many were filled. The answer: 456 of the 9,748 were vacant, 4.7 per cent of the country's orchestral chairs, and 7.1 per cent in the radio orchestras. Four hundred and fifty-six chairs, funded and empty, in one of the largest publicly funded orchestral systems in the world.
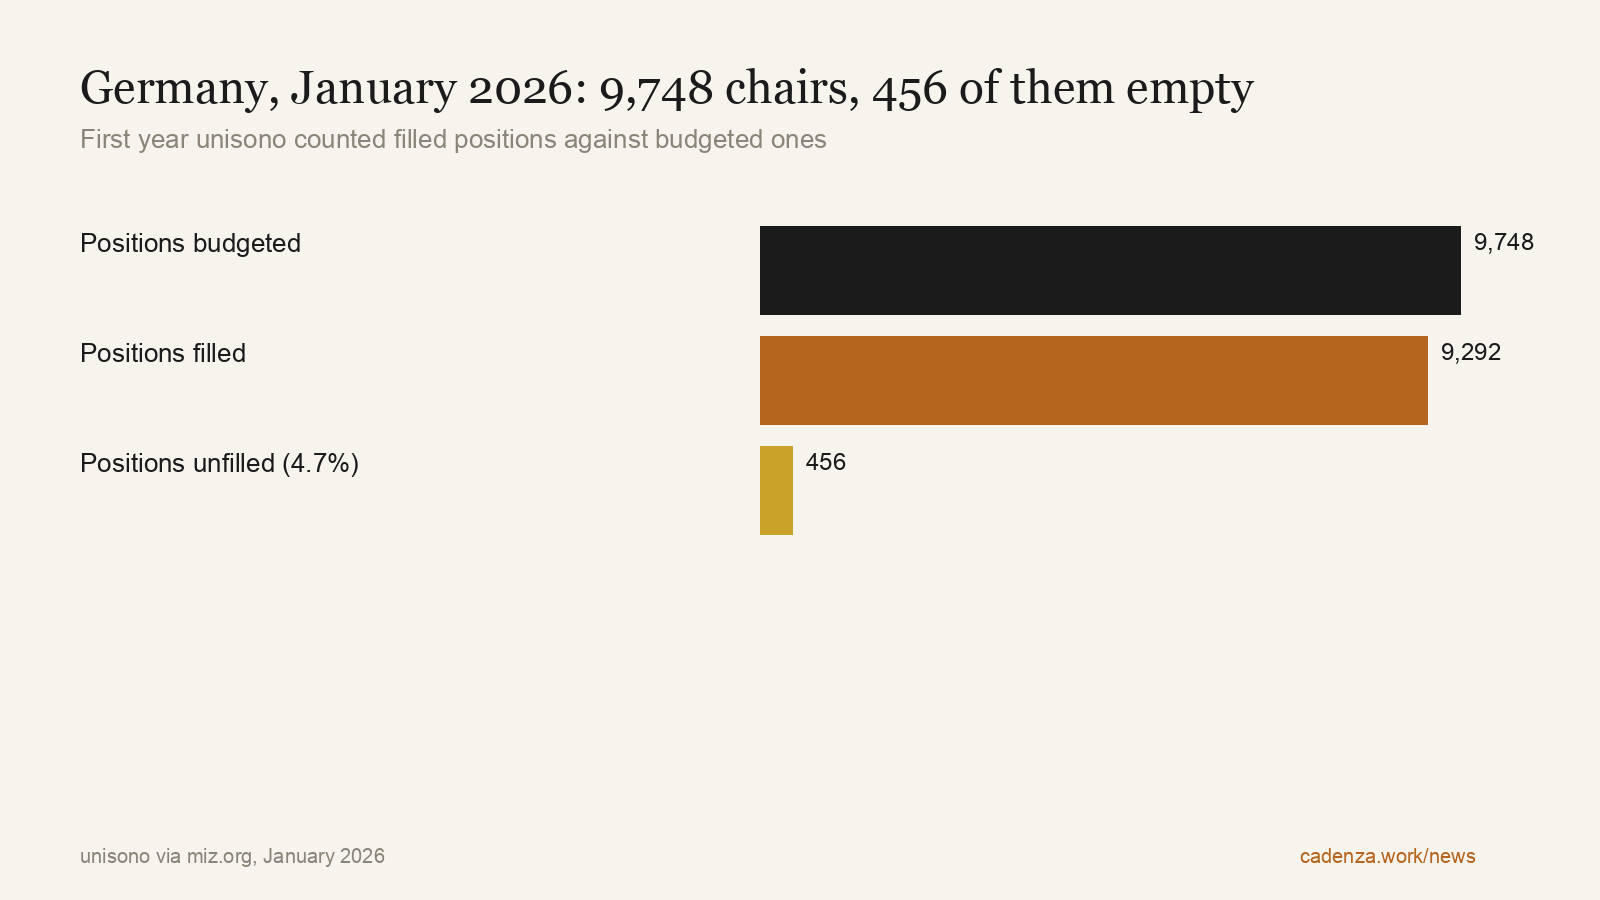
Set that beside Part II. Germany's own music universities hold 8,909 students of instrumental and orchestral music, two-thirds of them foreign nationals who came to Germany to train. The United States confers 7,193 performance degrees a year into a market that absorbs 130. And between the two, 456 chairs in Germany are empty: on 7 September, 99 of the 332 orchestral vacancies on Cadenza's board were German, the second-largest national total after the United States.
There are reasons an empty German chair is not simply an American graduate's for the taking, and they are worth stating precisely. The German audition is a Probespiel with orchestra-specific repertoire; the notice is in German and says nothing about pay, because a German reader is expected to know which TVK pay group the orchestra sits in; the language requirement for daily work is real; and the positions are, in the notices we checked, often a Vorspieler chair in Bielefeld or a third-and-first horn in Nürnberg rather than the chairs that appear on the walls of American practice rooms. But a system with 456 funded vacancies is a labour market with unmet demand, and a system that graduates 7,193 performers a year for 130 chairs is one with a surplus. That the two are separated by a language and an application form is the most fixable problem in this investigation.
Part VII — Britain's other model
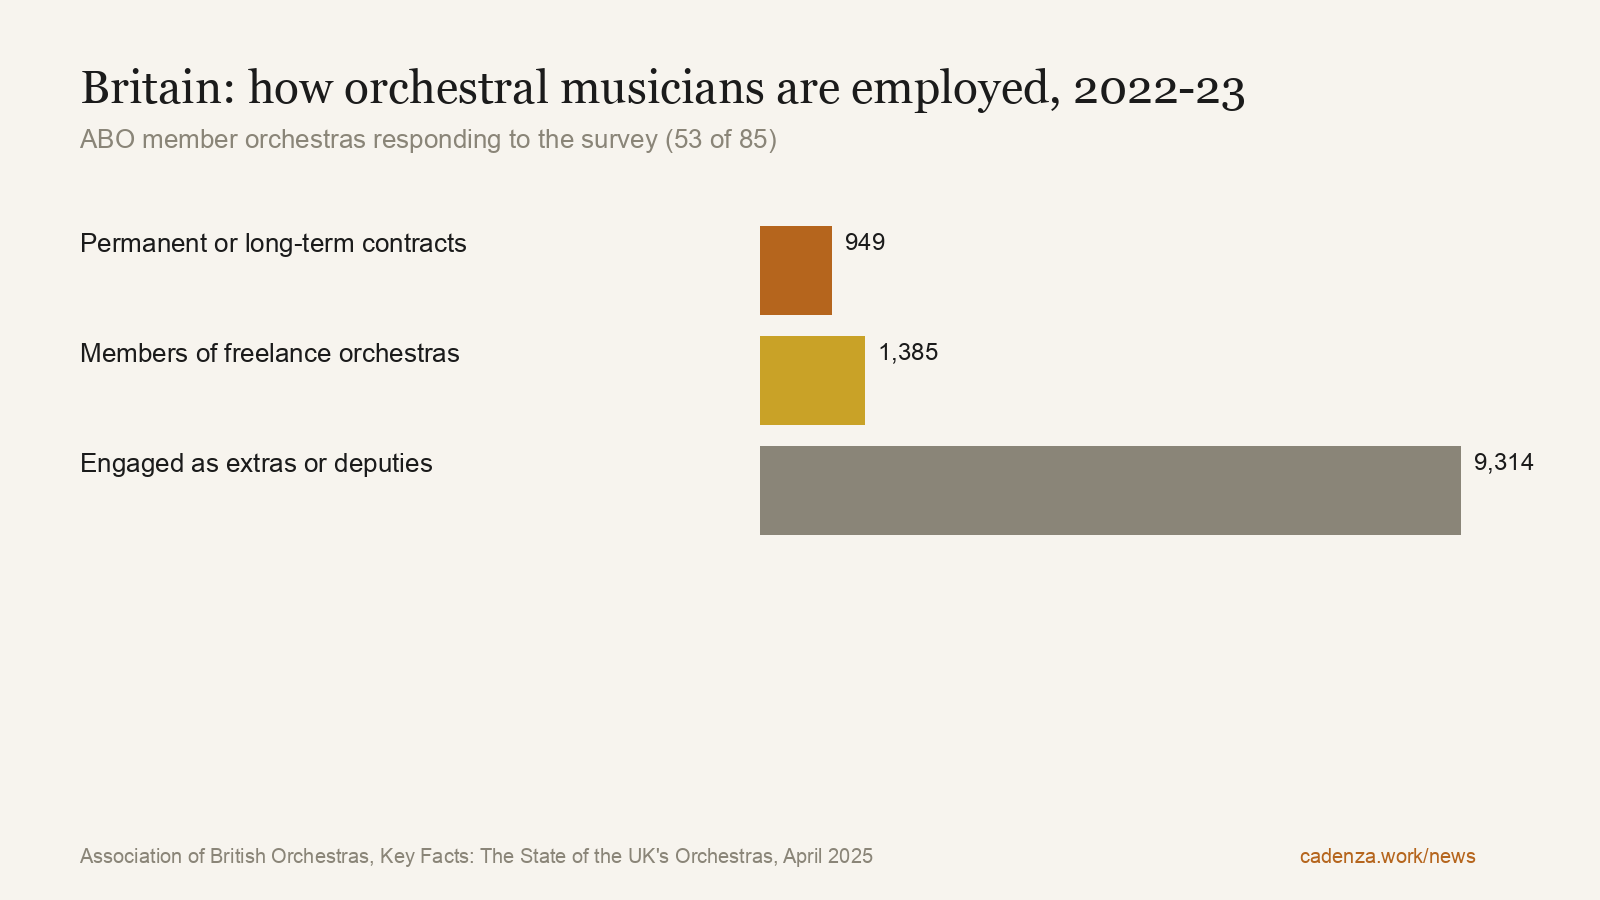
The Association of British Orchestras, whose members are the country's professional orchestras, surveyed them in early 2024 about the 2022–23 season and published the results in April 2025. Fifty-three of its 85 member orchestras answered. The employment figures describe a system that is neither the American one nor the German one.
949 musicians were employed on permanent or long-term contracts, 15 per cent fewer than in 2019. A further 1,385 held member status in freelance orchestras, the self-governing London model in which players are members of the company rather than its employees, up 34.6 per cent on 2019. And 9,314 musicians were engaged as extras or deputies, down 21.8 per cent. The report's summary line, "2,334 holding member status with freelance orchestras or permanent contracts," a 9 per cent rise on 2019, is the British equivalent of the 4,150.
The money behind those contracts is in the same report: total income across the respondents was £215.7 million (48 orchestras answered the finance section; the BBC orchestras are excluded), up 45.2 per cent on 2019, with more than £20 million of that from Orchestra Tax Relief. The rest of the finance figures are in Appendix A.
The British numbers are smaller and the shape is different: fewer salaried chairs, a large membership tier and a very large freelance tier that absorbs most of the graduates and pays by the engagement. Whether that is a better system for a young player, the report does not say. What it does say is that permanent contracts fell by 15 per cent in four years, and no British conservatory prints that in its prospectus either.
Part VIII — What the government counts
The United States Bureau of Labor Statistics does not count orchestra jobs. It counts "musicians and singers," a category that runs from the concertmaster of the Chicago Symphony to the wedding band, and its Occupational Outlook Handbook is the document a school guidance counsellor reads. Here is what it says, as accessed on 7 September 2026.
There were 170,400 such jobs in 2025. The median hourly wage in May 2025 was $47.80. Projected employment change from 2025 to 2035: "little or no change," 600 additional jobs over the decade. Openings: about 17,400 a year, "mostly expected to result from the need to replace workers who transfer to different occupations or exit the labor force." Typical entry-level education: "no formal educational credential", with the note that those pursuing classical or opera careers may pursue a bachelor's degree. Forty-eight per cent of the workforce is self-employed; 35 per cent are employed by religious, grantmaking, civic and professional organisations; 12 per cent by the performing arts and spectator sports industries. And one sentence that every prospectus should quote: "Many musicians and singers find only part-time or intermittent work and may have long periods of unemployment between jobs."
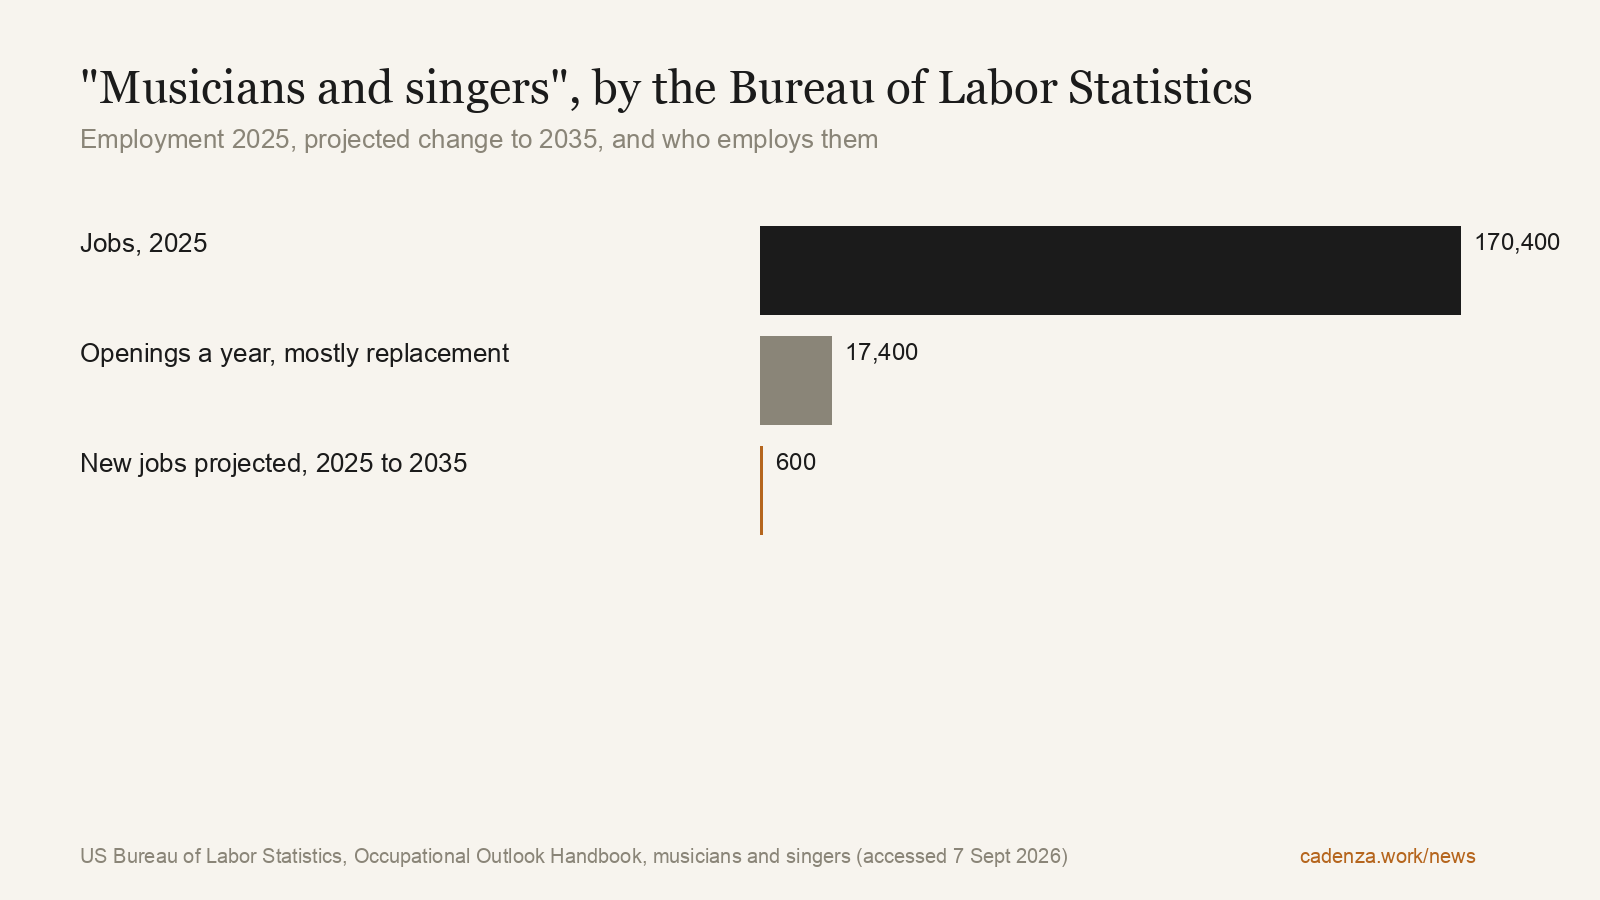
The 17,400 annual openings are real and the 7,193 graduates will fill some of them. But 17,400 openings across 170,400 jobs, 48 per cent of them self-employment, at a median that is hourly because the work is hourly, is a different labour market from the one a performance degree is designed for. The degree trains an orchestral musician. The government's category describes a gig economy. The 4,150 salaried chairs are 2.4 per cent of the government's number, and they are the part the degree is for.
The most useful survey of what music graduates actually do is the Strategic National Arts Alumni Project, which has surveyed arts graduates since 2008. Its 2022 survey, reported in April 2024, found 90 per cent of alumni of music programmes in the workforce, higher than the arts average of 87 per cent; 50 per cent of those music alumni were self-employed, against 41 per cent across arts and design; and about 10 per cent of arts and design alumni in the workforce identified their occupation as musician. Seventy-five per cent of arts alumni reported arts- or design-related duties in their jobs, and 60 per cent were "very satisfied" with their autonomy. SNAAP does not report income or debt for the music subgroup.
That is the fair reading of the outcome data: music graduates work, mostly for themselves, mostly in the arts, and mostly not in the job the degree names. None of that is a scandal. It is a description the institutions selling the degree could print.
Part IX — The case against this article
An investigation that does not argue against itself is an editorial. Here are the objections, put as strongly as we can put them.
The degree is not a job application. A bachelor's in music performance is an education, and the people who complete one go on to teach, arrange, produce, play in pits and churches and studios, and run the organisations that employ orchestras. SNAAP's 90 per cent workforce participation and 75 per cent arts-related duties are, by the standards of any humanities degree, a strong outcome. Measuring the degree against the salaried orchestra chair alone measures it against the narrowest possible target.
The count of chairs is too narrow. Peyrebrune's 4,150 counts positions paying $25,000 or more. Below that line are ROPA's 6,000 members and the thousands of per-service chairs in regional and community orchestras, plus opera and ballet pits, military bands, and the freelance orchestras that dominate Britain. A graduate who plays 98 services a year in Hartford holds an orchestral job. The market for orchestral playing is larger than the market for orchestral salaries.
The graduates are already declining. The IPEDS series fell 13 per cent between 2012 and 2024 and has stayed below 7,400 since 2021. The market is correcting on its own, through applicants' choices, and the schools that closed or shrank performance programmes in the last decade may have done so for this reason. An article demanding a correction that is already under way is late.
Germany's vacancies are not a free lunch. A vacant chair in a German radio orchestra is vacant because the orchestra did not find a candidate it wanted at its Probespiel, which the Berlin Philharmonic's own description of the process makes clear can end with no appointment. The 456 unfilled positions are evidence of high standards, and possibly of pay and location, not of a door standing open.
The odds are the point. Peyrebrune titled his paper "It's Supposed to Be Hard." Orchestras exist to be selective; a 5 per cent success rate over ten years is what excellence costs, and the musicians who pay it know the price. Nobody is deceived.
We accept the first four in part and reject the fifth. The degree is an education, and the article says so; but the schools recruit on the strength of the orchestra, and the outcome data belongs beside the recruiting. The count is narrow, and the article says so; but $25,000 is the line below which the chair is not a living, and the article is about livings. The decline is real; but 7,193 into 130 is still 55 to 1, and it was 64 to 1 in 2012, and the difference is not a correction. Germany's vacancies are not a free lunch; but they are the largest body of funded, unfilled orchestral positions we have found in any published census, and whether the obstacle is the standard, the pay or the notice is the question we put to unisono in Part XI. And on the fifth: the odds may be the point, but the odds are not printed, and "nobody is deceived" is only true of people who have found the SABR journal, the IPEDS API and the unisono census on their own. The purpose of this investigation is to make that unnecessary.
Part X — What should change
Cadenza does not publish a diagnosis without a prescription. These are addressed to the institutions that hold the documents, and each one can be done this season.
1. Print the pay. Every audition notice should state the base salary or the per-service rate, the number of guaranteed weeks or services, and the pay group where a collective agreement applies. 15 of the 29 notices closing this month do it; the other 14 have no reason not to. Helsinki prints a monthly range. Houston prints its minimum. A candidate who will spend $483 to attend should not have to spend it to learn the number.
2. Pay for the preliminary round, or hold it on video. The AFM's own negotiator could not name an orchestra that pays preliminary-round expenses. The alternative, a recorded first round, is already how the New York Philharmonic screened its principal cello in the spring of 2026: its recording specification sheet accepts "audio only recorded auditions as .WAV files or .mp3 files," to be heard blind. Many European orchestras already take applications through Muvac. An orchestra that hears 200 candidates in person is asking 200 people to spend $483 each, close to $100,000 in aggregate, for a process it could conduct for the cost of a listening panel.
3. Abolish the deposit. A refundable $35 to $100 cheque is a small sum to an orchestra and a real one to a graduate earning $29,248. Its purpose, to deter no-shows, can be served by a confirmed booking. Quad City has done without it. So can everyone.
4. Publish placement. Every conservatory and school of music that recruits on the strength of the orchestra should publish, annually, how many of its performance graduates hold a salaried orchestral position five years out. The data exist: schools track alumni, and the College Scorecard tracks earnings by programme. A school that does not print the number leaves the applicant to guess it.
5. Build the bridge to the empty chairs. Four hundred and fifty-six funded German vacancies and 7,193 American graduates a year are a matching problem. The pieces of a solution exist in isolation: the German orchestra academies (Nürnberg advertises two this month at €1,150 a month with pension), the language requirements that are learnable in a year, the Muvac platform that already takes applications from anywhere, and the TVK tables that explain what a chair is worth. What is missing is a single place where an American graduate can see a German vacancy with its pay group translated, its repertoire listed and its language expectation stated. Cadenza will build it, and will start by carrying the pay group on every German listing it verifies.
6. Count the market every year. Peyrebrune's 4,150 is from 2018–19 and was published in a baseball journal; no orchestral body publishes an equivalent annual count of first-time hires. The League of American Orchestras collects the data through its Orchestra Statistical Report. ICSOM and ROPA hold the rosters. unisono counts Germany every second January and the ABO counts Britain every cycle. The American number should be published annually by the people who hold it, with the number of first-time hires beside it.
7. Tell the students the sum. Not to discourage them. To let them decide. The musicians who win the 130 chairs each year do so knowing the odds; the ones who spend ten years and $30,000 finding out deserve to have known on the day they enrolled.
Part XI — The questions
For the schools of music: how many of your performance graduates of 2016, 2018 and 2020 hold a salaried orchestral position today, and why is that figure not on your admissions page?
For the orchestras that print no pay: what is the chair worth, and why should a candidate travel to find out?
For the orchestras that take deposits: what does the deposit achieve that a confirmed booking would not?
For ICSOM, ROPA and the League: will you publish, annually, the number of salaried chairs and the number of first-time hires, so that the next count of the market does not have to be done by a bassist in his spare time?
For unisono and the German orchestras with 456 empty chairs: what would it take to fill them from abroad, and is the obstacle the standard, the pay, the language, or the notice?
For the Bureau of Labor Statistics: is a category that puts the concertmaster of Chicago and a wedding singer in the same 170,400 the right instrument for a student deciding whether to borrow $300,000?
Part XII — The verdict
The orchestral career is not dying. It is, by every document in this ledger, one of the most stable jobs in the performing arts: a 31.9-year average tenure, salaried minimums above $200,000 at the top and above $110,000 at the two full-season American chairs advertised this month, a German system that has held 9,748 chairs steady for eight years and has 456 of them unfilled, a British sector whose income rose 45 per cent in four years. The chairs are real and the money is real.
What is broken is the sum. Seven thousand one hundred and ninety-three performance degrees a year into 130 first-time salaried hires is 55 to 1, and it has been above 50 to 1 for every year in the 2012 to 2024 series. The people who produce the 7,193 do not print the 130. Nearly half of the 29 notices closing this month print no pay. The candidates pay to attend, pay to record, and pay a deposit for the privilege. And the largest body of funded, empty chairs in any census we found sits in a country whose notices assume you already know what they mean.
Every number in this article is public, and every one is the institution's own. The failure is not one of honesty but of assembly, and assembly is a thing a newsroom can do. This is the ledger. The questions above are open, and the next count will be printed here in a year, with the answers of everyone who gives one.
Methodology, standards and corrections
Every figure in this investigation was taken from a document we fetched on 6 or 7 September 2026 and is linked at the point of use and listed again in Appendix A. Where a figure is an estimate by its author (Peyrebrune's 4,150 and 130, Muñoz's 120) it is attributed as one. Where a figure is Cadenza's own classification (the 332 orchestral vacancies out of 492 job listings, the country split) the text says so; the raw lane totals are on the public API. Ratios are our arithmetic on the sources' figures and are shown to the nearest whole number. The headline degree figure is the general performance code alone (7,193); the seven-code performance family (9,286) is given in Part II and Appendix A and would raise every ratio by about a third. Currency is as stated by the source; no conversions were made except the Helsinki monthly figure multiplied by twelve, which is labelled. Charts were drawn by Cadenza from the same figures and carry their sources.
The 29 vacancy notices were checked twice, once by a verifier against each orchestra's page and once by an independent checker who re-fetched every row; the record is with the audition ledger. This article was itself fact-checked claim by claim before publication; the check returned 24 corrections, two of them to sources and one to the reading of a source, all applied and listed in the record beside the article in Cadenza's newsroom repository.
We will correct any figure an institution shows to be wrong, in place and with a note here. The count will be repeated in September 2027.
Appendix A — The evidence ledger
| Figure | Value | Source |
|---|---|---|
| ICSOM members | "over 4,000 musicians from 51 major symphony orchestras" | icsom.org/about |
| ROPA members | "nearly 90 orchestras and more than 6000 musicians in North America" | ropaweb.org/about |
| Salaried positions ≥ $25,000, 2018–19 | about 4,150, roughly 55 orchestras | Peyrebrune, SABR Baseball Research Journal, spring 2025 |
| Big 7 musicians vs MLB roster | 727 vs 780 | same |
| New salaried hires a year, 2006–07 to 2018–19 | about 130 | same |
| Average career length | 31.9 years (orchestra), 3.7 (baseball) | same |
| Résumés per position | "as many as 200" | same; Yeo ("more than 200 players") |
| Ten-year success rate | "nearly 5%" | Peyrebrune |
| Openings, alternative estimate | about 120 a year at 3% turnover | Muñoz, Before The Audition, 31 May 2026 |
| Music performance completions, 2012–2024 | 8,284 → 7,193 | IPEDS via Data USA API |
| Performance-family completions (seven CIP codes), 2012 / 2024 | 10,002 / 9,286; 2024 split 7,193 general, 668 voice and opera, 589 strings, 534 keyboard, 158 woodwind, 109 brass, 35 percussion; top general-code producers 2024: Indiana 339, Berklee 325, Rochester 206, Johns Hopkins 200; Juilliard 117 strings, 47 keyboard, 24 voice | IPEDS via Data USA API, CIP4 5009 by CIP6 and by University |
| Completions by level | 3,937 / 2,481 / 491 / 196 / 88; 370 schools | College Factual |
| Median earnings 1/4/5 years after completion | $29,248 / $35,586 / $40,828 | College Scorecard via College Factual |
| Music degrees a year (US public four-year institutions); conservatory four-year cost | 13,950 (2023); up to $363,000 | Cadenza, The $300,000 Music Degree |
| German music students, WS 2024/25 | 31,092 registrations; 8,909 instrumental/orchestral; 1,563 singing; 324 conducting | miz.org |
| Foreign share of instrumental/orchestral students | 6,047, about 68%, vs about 52% twenty years earlier | miz.org |
| German orchestras and positions, 1992 / 2018 / 2026 | 168 & 12,159 / 129 & 9,746 / 129 & 9,748 | miz.org, unisono |
| Unfilled German positions, January 2026 | 456 (4.7%); radio orchestras 7.1% | same |
| East/West decline 1992–2020 | East 5,032 → 3,132 (−40%); West about −500 (−7%) | same |
| ABO survey respondents | 53 of 85 member orchestras; season 2022–23 | ABO Key Facts, April 2025 |
| UK musicians on permanent/long-term contracts | 949 (−15% vs 2019) | same |
| UK members of freelance orchestras | 1,385 (+34.6%) | same |
| UK extras and deputies | 9,314 (−21.8%) | same |
| UK combined member status or permanent | 2,334 (+9%) | same |
| UK income, earned income, ticket sales | £215.7m (+45.2%); £94.6m; £34.9m | same |
| UK public funding; Orchestra Tax Relief | £52.7m total, £51.5m revenue; "over £20 million" | same |
| UK concerts and audience | 2,993 (−16.5%); 3,141,365 (−26.1%); 374 abroad in 34 countries | same |
| BLS musicians and singers | 170,400 jobs (2025); $47.80/h; 0% growth, +600 to 2035; 17,400 openings a year; 48% self-employed | BLS OOH |
| SNAAP 2022 | 90% of music alumni in workforce; 50% self-employed; ~10% of arts alumni working as musicians | SNAAP report, April 2024 |
| Preliminary-round expenses | "I have yet to hear of any symphonic orchestra who pays the expenses of preliminary round candidates" | Kahn, International Musician, 25 Sept 2015 |
| Six auditions, 2019 | $2,897; average $483 | Hokamp, 5 March 2020 and page 2 |
| Deposits in current notices | $35 Stockton; $50 Hartford, Elgin; $100 Jacksonville, Virginia; $75 Sarasota; none at Quad City | orchestra notices via the audition ledger; Sarasota |
| SFS minimum | $3,450 → $3,960 a week; $205,920 annualised | SF Chronicle, 12 Sept 2025; SFCV, Sept 2025 |
| Weekly bases, Nov 2025 | Boston $3,895; Chicago $3,810; New York $3,667; Philadelphia $3,390; LA $4,016 total comp | All Is Yar, 16 Sept 2025 |
| Thirteen-orchestra minimum range | about $116,000–$206,000 | Cadenza, The Orchestra Pay Gap |
| Stated pay in 29 closing notices | 15 figures, 1 "individual", 13 nothing; figures as quoted in Part V | orchestra notices, 7 Sept 2026 |
| Cadenza board | 492 job listings; 332 orchestral vacancies (Cadenza classification); 124 orchestras; 19 countries | API |
| Berlin Philharmonic process | online form, audio, several rounds, "If no one does, the position remains vacant" | berliner-philharmoniker.de |
Appendix B — Where the open chairs are
The 332 orchestral vacancies on Cadenza's board on 7 September 2026, by country and by instrument tag, as classified by Cadenza. The country field merges the codes and names the index uses interchangeably and fills in the orchestra's country where a listing has none.
| Instrument tag | Vacancies |
|---|---|
| Violin | 89 |
| Viola | 45 |
| Double bass | 30 |
| Horn | 27 |
| Cello | 24 |
| Trumpet | 18 |
| Oboe | 17 |
| Trombone | 15 |
| Clarinet | 14 |
| Flute | 12 |
| Bassoon | 7 |
| Tuba | 6 |
| Percussion | 5 |
| No instrument tag | 24 (one listing carries two tags, so the column sums to 333) |
149 of the 332 titles are principal, solo, concertmaster or Vorspieler chairs. Every listing is on the jobs board, free to musicians, and the 29 closing this month are itemised with their pay lines in the audition ledger.
Sources: ICSOM, About; ROPA, About; Henry Peyrebrune, "It's Supposed to Be Hard," Baseball Research Journal, spring 2025; Alfredo Muñoz, "The Orchestral Labor Market, Measured," Before The Audition, 31 May 2026; IPEDS completions, CIP 50.0903, via Data USA; College Factual, Music Performance; Deutsches Musikinformationszentrum, Planstellen; miz, Studierende in Studiengängen für Musikberufe; miz, Studierende mit ausländischer Staatsbürgerschaft; Association of British Orchestras, Key Facts, April 2025; BLS, Occupational Outlook Handbook, Musicians and Singers; SNAAP, 2022 survey report; Nathan Kahn, International Musician, 25 September 2015; Alyse Hokamp, The cost of orchestral auditions, 5 March 2020; Douglas Yeo, Symphony auditions; Berliner Philharmoniker, The open question; San Francisco Chronicle, 12 September 2025; San Francisco Classical Voice, September 2025; New York Philharmonic, Principal Cello recording specification sheet, spring 2026; All Is Yar, 16 September 2025; Sarasota Orchestra, careers and auditions; Cadenza listings API; Cadenza, The $300,000 Music Degree; Cadenza, The Orchestra Pay Gap; Cadenza, The Audition Ledger.
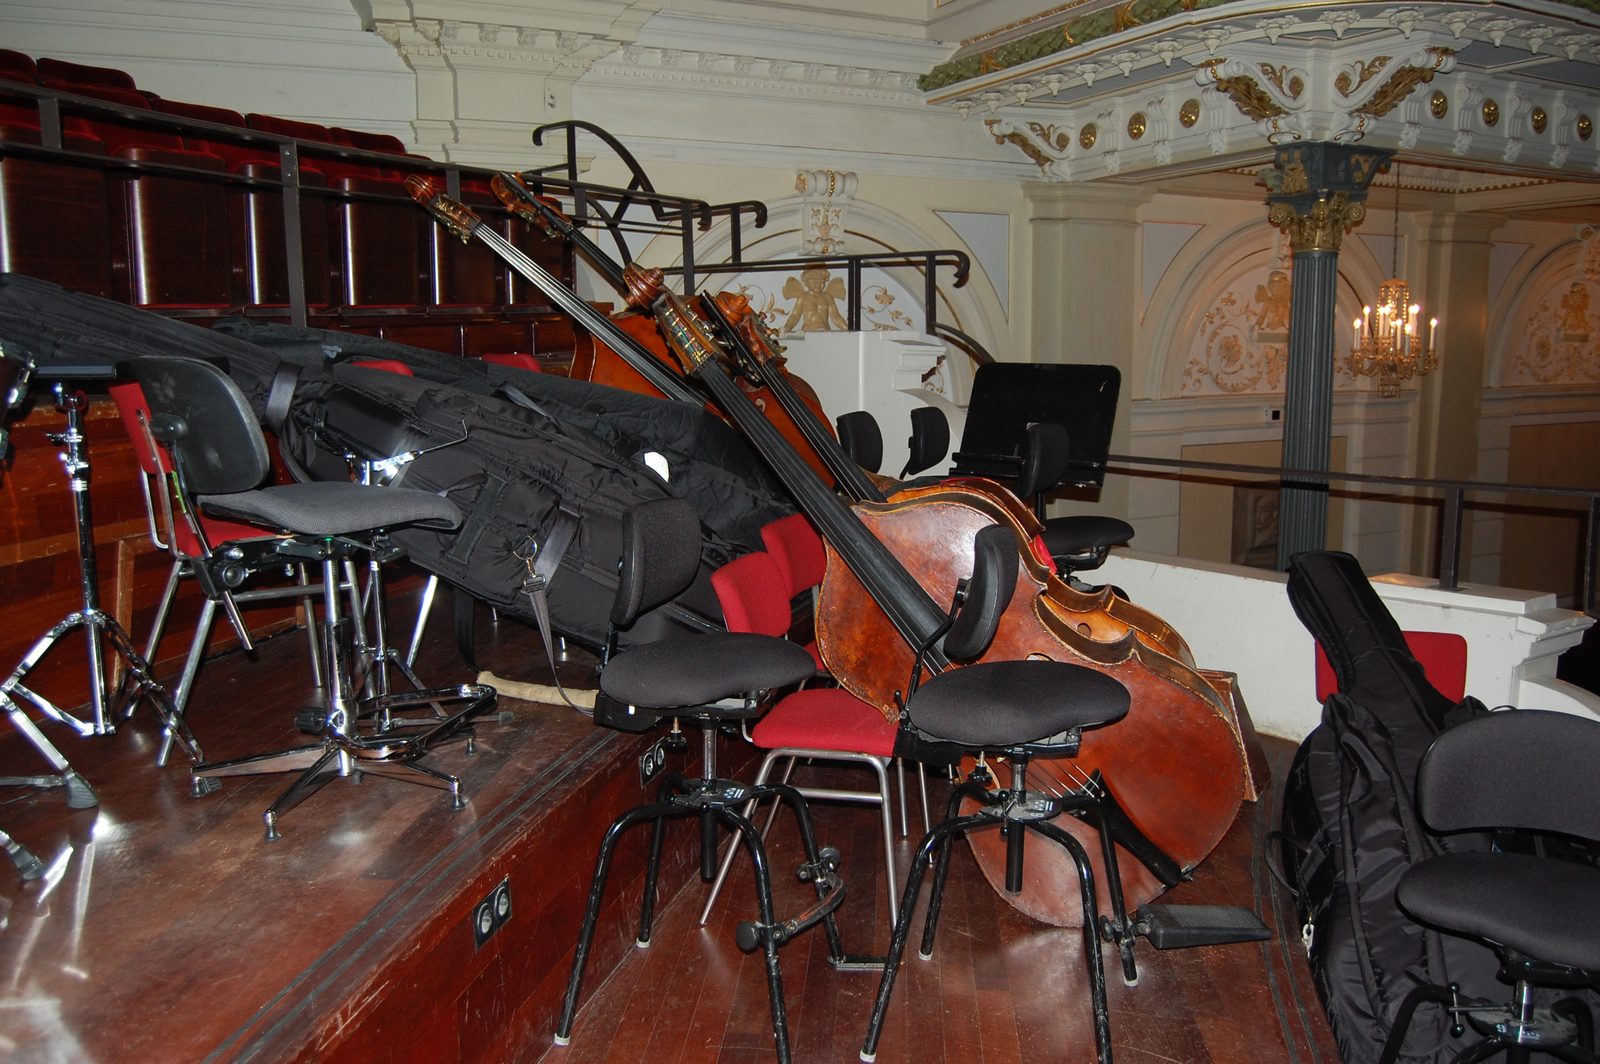
Cover photograph: The stage of the Concertgebouw's Grote Zaal, Amsterdam, photographed during a guided tour in February 2017, with the double basses waiting. Ellywa, CC BY-SA 4.0, via Wikimedia Commons.
Comments
Sign in to join the discussion.